File:RC charging discharging curves GHood.png
Error creating thumbnail: sh: /usr/bin/convert: No such file or directory
Error code: 127
Other resolution: 890 × 710 pixels.
Original file (890 × 710 pixels, file size: 81 KB, MIME type: image/png)
Summary
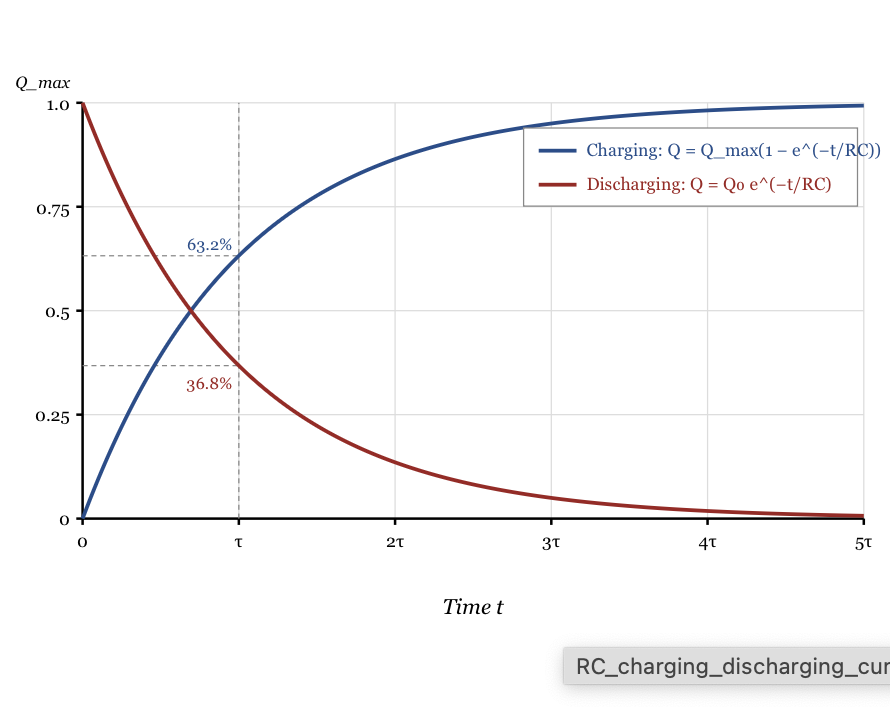
RC charging and discharging curves: normalized charge Q(t)/Q_max vs. time t (in units of τ = RC). Shows charging Q = Q_max(1 − e^(−t/RC)) reaching 63.2% at t = τ, and discharging Q = Q_0 e^(−t/RC) falling to 36.8% at t = τ. Original diagram created for the Charging and Discharging a Capacitor page by Gabriel Hood, Spring 2026. No third-party copyright.
File history
Click on a date/time to view the file as it appeared at that time.
| Date/Time | Thumbnail | Dimensions | User | Comment | |
|---|---|---|---|---|---|
| current | 20:33, 26 April 2026 | Error creating thumbnail: sh: /usr/bin/convert: No such file or directory
Error code: 127 | 890 × 710 (81 KB) | Ghood6 (talk | contribs) | RC charging and discharging curves: normalized charge Q(t)/Q_max vs. time t (in units of τ = RC). Shows charging Q = Q_max(1 − e^(−t/RC)) reaching 63.2% at t = τ, and discharging Q = Q_0 e^(−t/RC) falling to 36.8% at t = τ. Original diagram created for the Charging and Discharging a Capacitor page by Gabriel Hood, Spring 2026. No third-party copyright. |
You cannot overwrite this file.
File usage
The following page uses this file: